

Tutorial: journal figures from the command line
This tutorial makes a complete set of journal figures with vibe-viewer
commands only: structure panels that share one camera, composed into a
two-column PDF; vector line art; a band structure beside its DOS; a cyclic
cluster inside its Wigner–Seitz supercell; and a periodic pore channel with
its numbers. Each step is one command, so the whole set is a script you can
keep beside the manuscript and run again.
It takes about ten minutes. You need:
a vibe-viewer that includes the command-line figure options. They are on development
mainafter 3.0.9; the 3.0.8 desktop app does not have them. If a command answersNo such option, run a source checkout as shown in Troubleshooting;an off-screen OpenGL context for the PNG captures (setting up a headless host);
vibe-viewer capture-selftestchecks it;SciPy (the
surfacesextra) for steps 5 and 6.
1. Get the inputs
Download make_inputs.py
and figures.sh into an
empty directory, then write the inputs:
python make_inputs.py
This writes seven small archives. They are illustrative inputs, not
calculations: conventional cells of diamond, rock-salt MgO and zinc-blende ZnS
with rounded lattice constants, three MgO(001) layers periodic in a and b, the
two-atom primitive MgO cell, a pore channel between carbon rods, and
model-bands.qvf. That last one holds bands and a DOS from a toy
nearest-neighbour tight-binding model on an fcc lattice, written so the chart
commands have something to draw; it is not a material. Replace any of them with
your own archives: the commands only need the section kinds named below.
To make every figure at once, run sh figures.sh; it writes them into
figures/. The steps below take the same commands one at a time and explain
the choices.
2. Four structures, one camera, one PDF
Use the same camera flags for every panel, so the four structures are seen the same way:
CAMERA="--view 1,0.35,0.2 --orthographic --background white --publication --dpi 600 --width-mm 88 --size 4x3"
for name in diamond rocksalt zincblende slab; do
  vibe-viewer capture "$name.qvf" $CAMERA -o "figures/$name.png"
done
vibe-viewer figure figures/diamond.png figures/rocksalt.png figures/zincblende.png \
    figures/slab.png --width-mm 178 -o figures/structures.pdf
--view 1,0.35,0.2places the camera along that Cartesian direction.--uvwand--hklwould use crystal directions, but they need a 3D cell and the slab has none, so a set that includes a slab shares a Cartesian view.--orthographicuses a parallel projection, the usual choice for crystals.--dpi 600 --width-mm 88captures each panel at 2079 pixels, its printed width at 600 dpi. Two 88 mm panels and the default 2 mm gap fill a 178 mm two-column figure.--publication --background whitegives outlined atoms on white.
figure reports the grid, size and font, and each panel’s effective
resolution:
4 panels, 2 x 2: 178 x 134.0 mm, Arial 9 pt, PDF
(a) diamond.png: 2079 x 1559 px at 88.0 mm, 600 dpi
...
It flags any panel below 300 dpi, so a panel captured too small is caught before submission. The PDF embeds each panel with its own pixels and keeps the (a)–(d) labels as text.
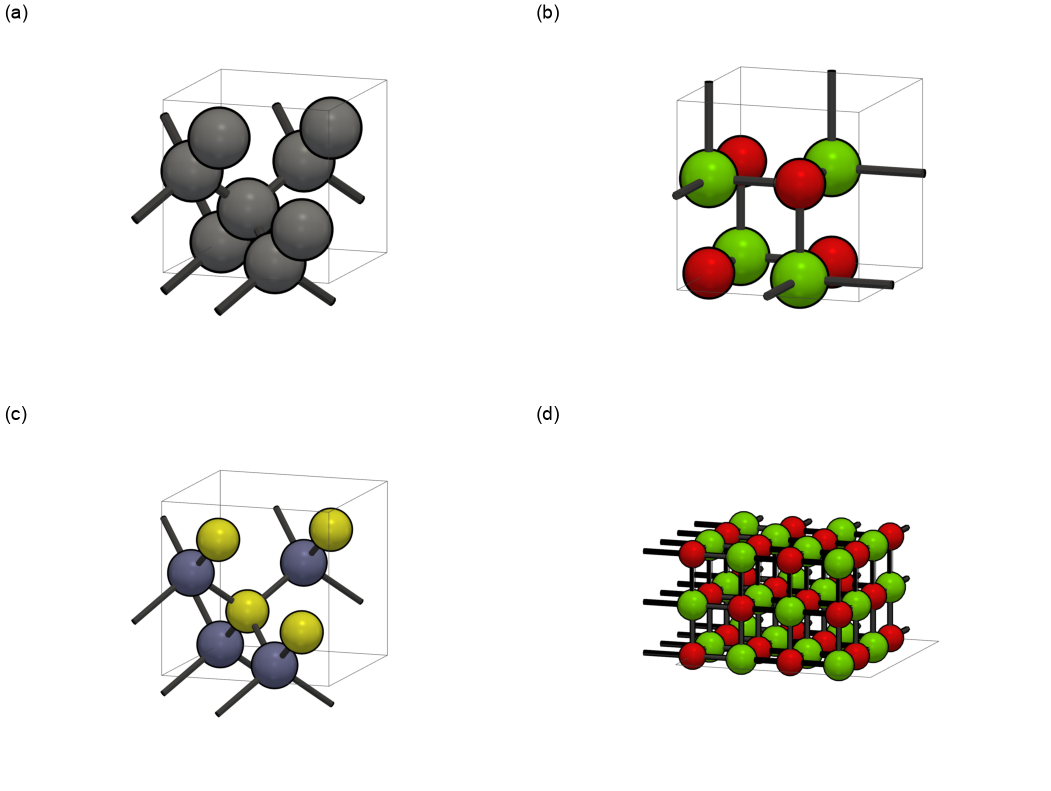
3. Vector line art
Some journals ask for structures as line art. An .svg or .pdf output draws
the structure as vector circles and sticks instead of a rendered image, using
the same camera flags:
vibe-viewer capture zincblende.qvf --uvw 1,1,0 --background white --width-mm 85 \
    -o figures/zincblende-110.svg
Here --uvw 1,1,0 looks down the [110] lattice direction of the 3D cell, with
the b axis up, as the browser’s crystal-direction control does. The projection
is always orthographic. Atoms are drawn far to near, so nearer atoms and bonds
cover the ones behind. Along [110] the zinc-blende cell shows its Zn–S dumbbell
columns:

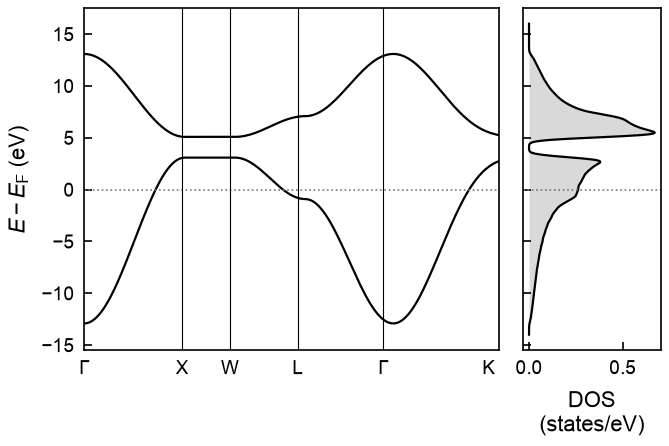
4. Band structure and DOS
A bands section or a DOS section is drawn as a static chart at a printed width, in a journal font, as PDF, SVG or PNG:
vibe-viewer capture model-bands.qvf -s bands --dos dos --width-mm 85 --size 3x2 \
    -o figures/bands-dos.pdf
vibe-viewer capture model-bands.qvf -s dos --font serif --font-size 9 --width-mm 60 \
    -o figures/dos.svg
--dos dos puts the DOS section beside the bands on one energy axis, which is
why the bands must carry a Fermi energy. --size 3x2 sets the aspect ratio, so
the chart is 85 × 56.7 mm. The PDF embeds its font and the SVG keeps its labels
as editable text. Neither records a creation date, so running the command again
gives the same file.
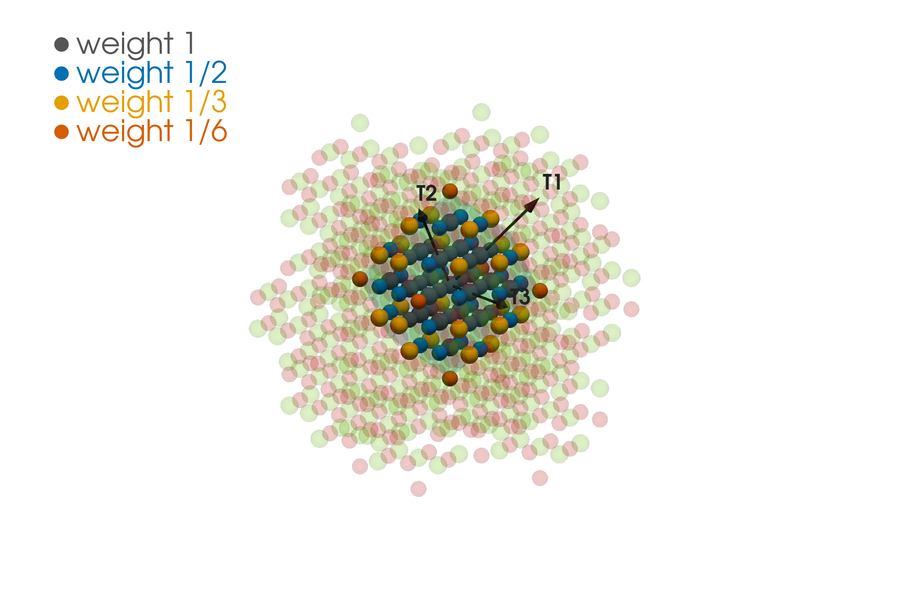
5. A cyclic cluster and its Wigner–Seitz supercell
For cyclic-cluster calculations, draw the Wigner–Seitz supercell around a reference atom and the weights of its boundary sites:
vibe-viewer capture mgo-primitive.qvf --wigner-seitz 3,3,3 --ws-center "element Mg" \
    --ws-weights colour --ws-cluster --background white --no-cell \
    --view 1,0.35,0.2 --orthographic --dpi 600 --width-mm 85 -o figures/mgo-cluster.png
--wigner-seitz 3,3,3takes the (3,3,3) supercell of the primitive cell, the 54-atom cluster, and--ws-center "element Mg"centres it on the Mg atom.--ws-weights colourdraws every site on the closed supercell, coloured by its weight 1/n, where n counts how often the site appears on the surface. For this rhombic dodecahedron the weights are 1, 1/2, 1/3 and 1/6, and they add up to 27 Mg and 27 O.--ws-clusteradds the neighbouring copies of the cluster, faded, and its translation vectors T1–T3 as arrows.
If your calculation treated a near-boundary atom differently, pass its weights
with --ws-weight-table. --ws-labels image labels each site with its atom
and image translation, the numbers a weight-table line takes:
vibe-viewer capture mgo-primitive.qvf --wigner-seitz 2,2,2 --ws-center "element Mg" \
    --ws-weights colour --ws-labels image --background white --no-cell \
    --view 1,0.35,0.2 --orthographic --size 1400x1000 -o figures/mgo-labels.png
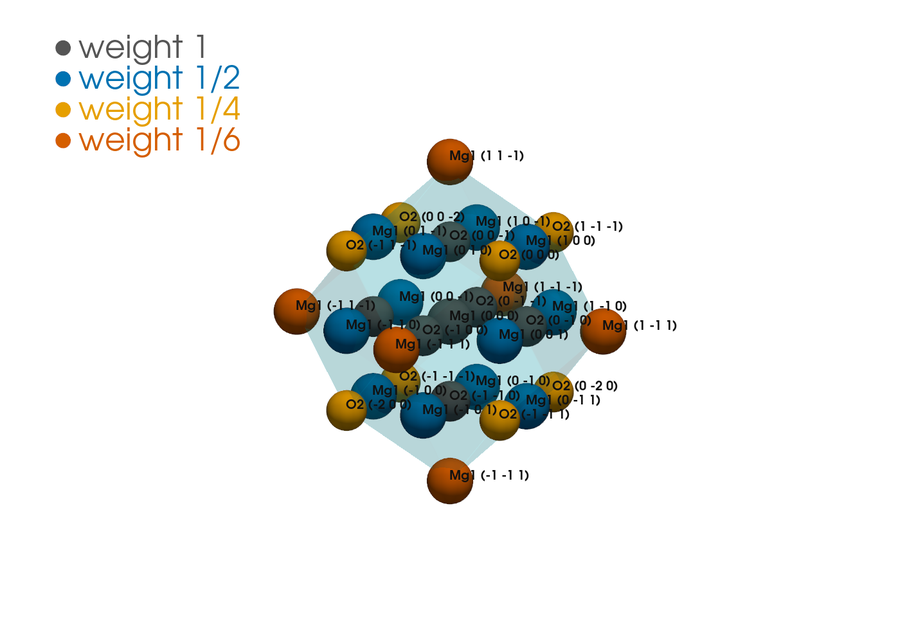
Labels crowd on large supercells. Use image labels to identify sites, and
--ws-labels name (Mg1, O2) or none for print.
6. A pore channel with its numbers
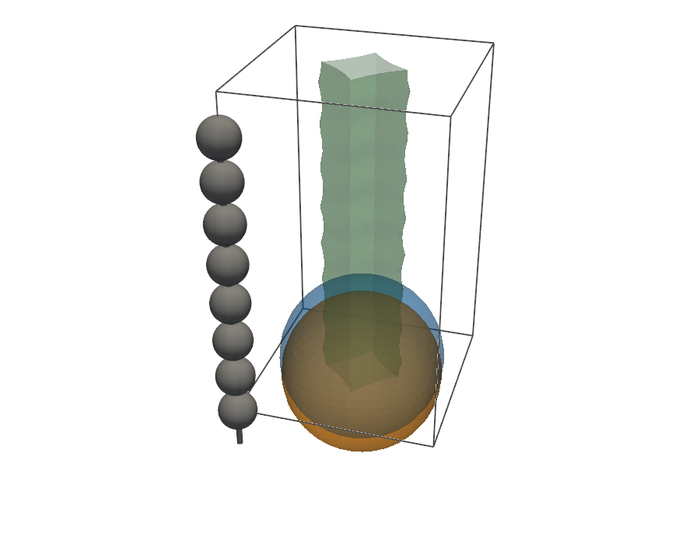
--pores runs the periodic pore estimate on the structure, prints its summary
and draws channels, cavities and the largest spheres:
vibe-viewer capture rods.qvf --pores --pore-probe 1.8 --pore-convergence \
    --pore-report figures/rods-pores.json --background white \
    --view 0.3,-1,0.6 --size 900x700 -o figures/rods-pores.png
The summary states the probe, grid resolution and whether the result converged when the grid was halved; for this channel the probe percolates along c. The JSON report keeps every number and setting beside the image.
Keep the figures reproducible
Keep
figures.sh, the input archives andvibe-viewer --versionwith the manuscript. The commands carry every camera, size and style choice.PDF and SVG output records no creation date, so a rerun with the same software and fonts gives identical files.
Named fonts must be installed:
--font "Times New Roman"is refused rather than substituted when the font is missing.sans-serifandseriftake the first installed of a list of journal fonts.Keep the pore and loading numbers from their JSON reports, not from the images.
Troubleshooting
No such option: --wigner-seitz(or--view,--pores,--font)The installed vibe-viewer predates these options. Run a source checkout of
maininstead, for exampleVV="env PYTHONPATH=/path/to/vibe-viewer/src python -m vibeviewer" sh figures.sh.Path 'x.qvf' does not existRun the commands in the directory where
make_inputs.pywrote the archives, or give full paths.Crystal directions require a 3D periodic cell--uvwand--hklneed a cell periodic in all three directions. Use--view X,Y,Zfor slabs and molecules.... selects 4 atoms, not one--ws-centermust name exactly one atom. In a conventional cell use--ws-center "index 1".- A blank or failed PNG
Check the off-screen context with
vibe-viewer capture-selftest; see Figures without a display.
Reference
Every option is described in Figures without a display: camera and print size, vector line art, band structures and DOS for print, multi-panel figures, pore networks and Wigner–Seitz supercells and cyclic-cluster weights. Publication figures covers labelled browser figures, scripted recipes and morph movies.